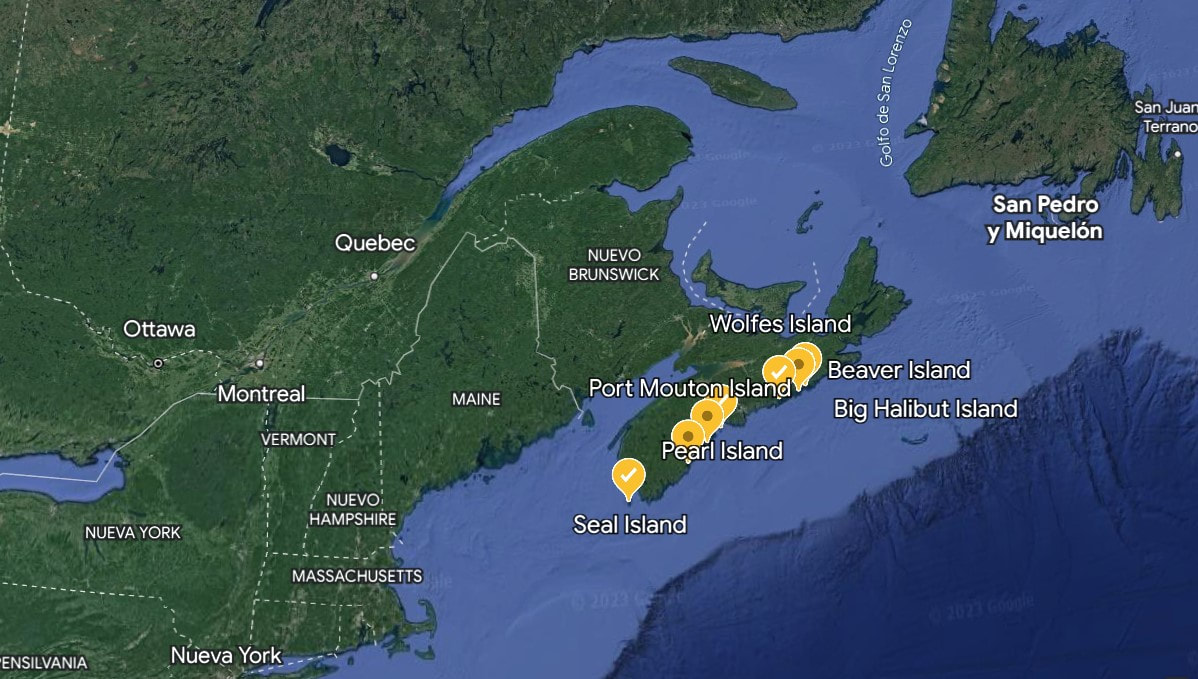
 Location of the ponds sampled in Nova Scotia With the aim to keep working on the sampling for the project, we contact with several bird experts from Canada: Douglas Hynes (Protected Areas Technician for Environment and Climate Change Canada) and Karel Allard (Protected Areas Coordinator for Environment and Climate Change Canada) with whom my supervisor Dr. John Smol previously collaborated. After some meetings, they mentioned the possibility of performing the sampling during autumn in different islands from Nova Scotia. The idea was to perform this field work within the expedition of the Foundation "Students on Ice (SOI)", that will take place from 3 to 29 Sept and in which different people linked to the ocean (scientists, students, divers, musicians, artists...) will do samplings and will share their work. 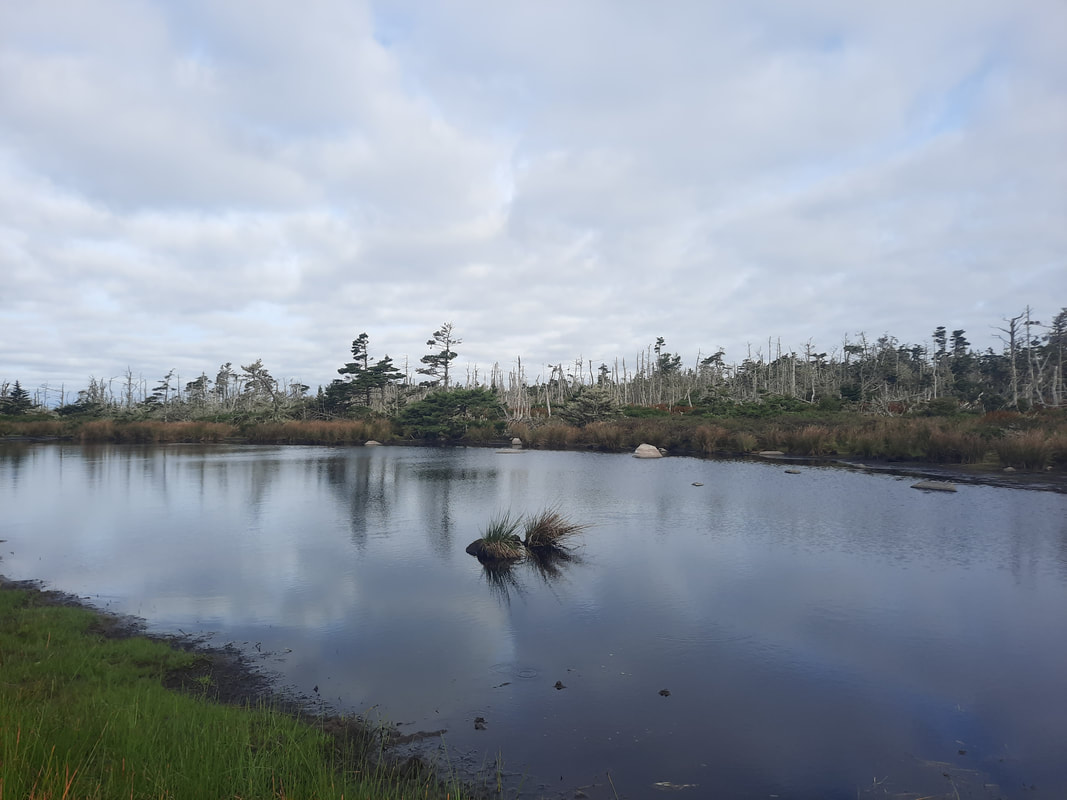 Pond from Seal Island After talking with some SOI members, we decided to embark from Sept 21 to 29, since it is when the islands that we are interested on will be visited. We sampled 7 ponds from 7 different islands: Seal Island (22 Sept); (during Sept 23 and 24 Hurricane Fiona hit the area so we had to stay in a safe port); Port Mouton Island (25 Sept), Cape La Have Island and Pearl Island (26 Sept), Big Halibut Island and Beaver Island (27 Sept), Wolfe Island (28 Sept). It was an amazing experience and it was very enlightening to be able of sharing with such different people from different areas. More info about this expedition is available in its webpage: https://soifoundation.org/en/youth/expeditions/ocean-conservation-expedition 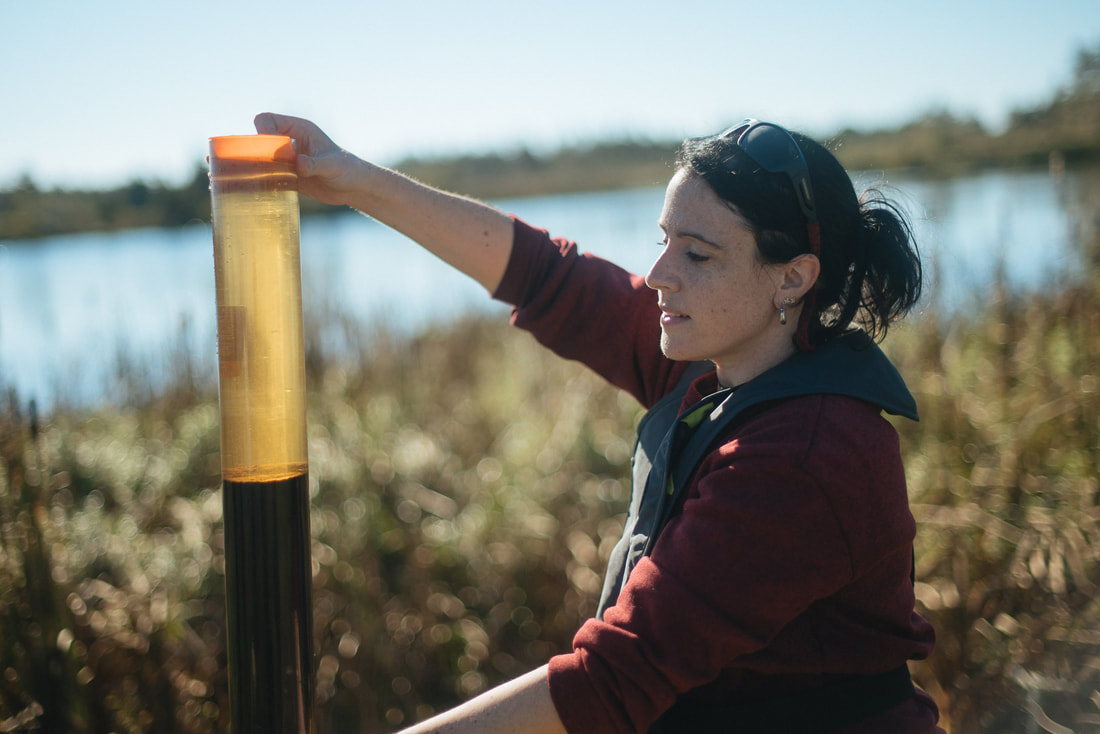 Me with a sediment core (Copyright: SOI Foundation). Con el fin de continuar con los muestreos de este proyecto, nos pusimos en contacto con distintos expertos en aves de Canadá como Douglas Hynes (Protected Areas Technician for Environment and Climate Change Canada) y Karel Allard (Protected Areas Coordinator for Environment and Climate Change Canada) con los cuales mi supervisor el Dr. John Smol había colaborado previamente. Tras una reunión llevada a cabo en Junio de 2022, ellos nos mencionan la posibilidad de ir a muestrear en otoño de ese mismo año a distintas islas localizadas en Nueva Escocia, por lo que comenzamos a planificar el viaje. La idea era llevar a cabo dichos muestreos dentro de una expedición que tendrá lugar gracias a la Fundación “Students On Ice (SOI)”, la cual tendría lugar durante el mes de Septiembre (3-29 de Septiembre) y en la cual distintos profesionales y estudiantes vinculados al océano (científicos/as, buceadores/as, músicos/as, artistas…) realizarán distintos muestreos y pondrán en común sus trabajos. 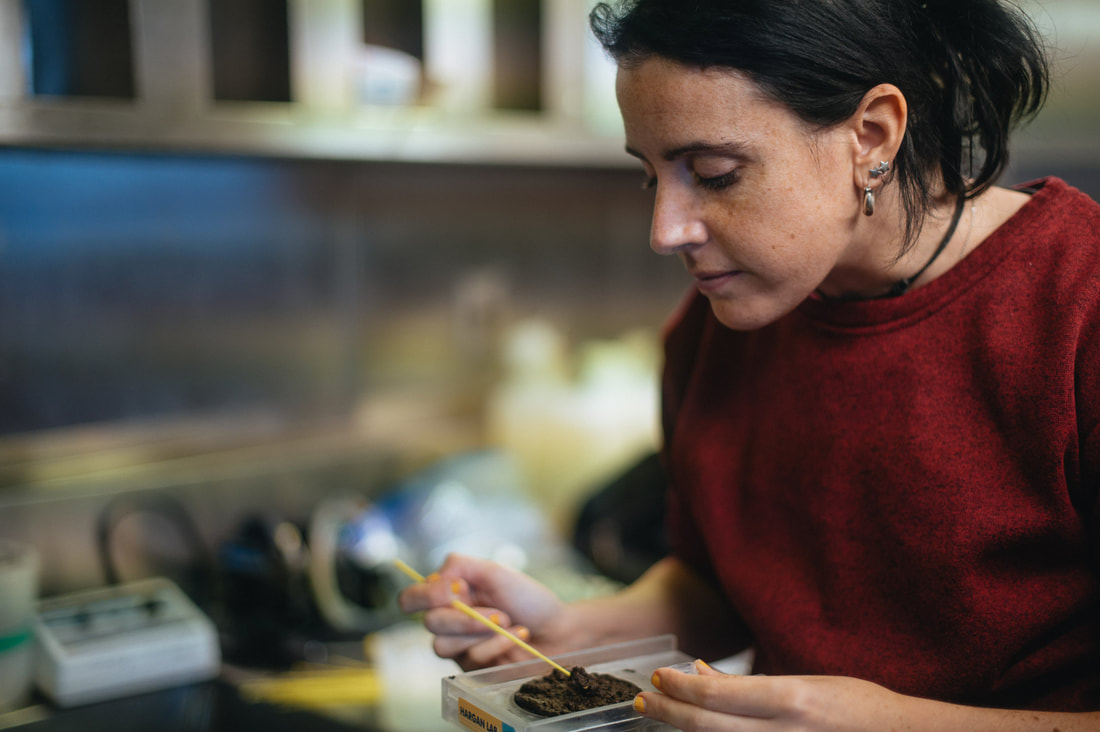 Me taking some subsamples from the sediment core for DNA. Miembros de la Fundación se ponen en contacto con nosotras y decidimos que embarcaremos del día 21 al día 29 de Septiembre, ya que durante dichos días se visitarán las lagunas de las islas que nos interesa estudiar. En total muestreamos 7 lagunas de 7 islas diferentes: Seal Island (22 Sept); (durante los días 23 y 24 de Septiembre, el Huracán Fiona azotó la zona por lo que tuvimos que mantenernos anclados en un puerto seguro); Port Mouton Island (25 Sept), Cape La Have Island y Pearl Island (26 Sept), Big Halibut Island y Beaver Island (27 Sept), Wolfe Island (28 Sept). Fue sin duda una experiencia maravillosa y muy enriquecedora al poder compartir con tantas personas de distintos ámbitos. Más información acerca de esta expedición, en la página web oficial de la expedición: https://soifoundation.org/en/youth/expeditions/ocean-conservation-expedition
0 Comments
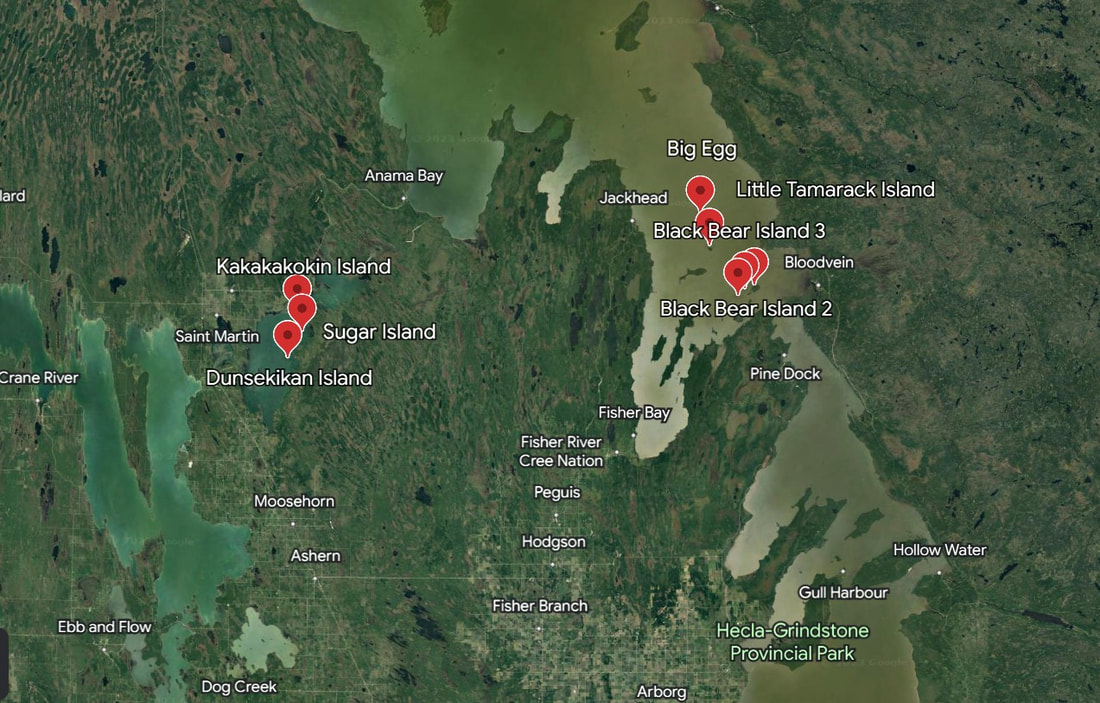 Location of the ponds sampled/Localización de las lagunas muestreadas Since PAST project is focused in studying long-term changes in bird populations by using paleolimnological approaches, we must choose an area according with these requirements: 1. With ponds located near to each other and where we were able to sample by using sediment cores. 2. Presence of breeding aquatic bird colonies in most of the ponds. 3. Ponds not previously studied. 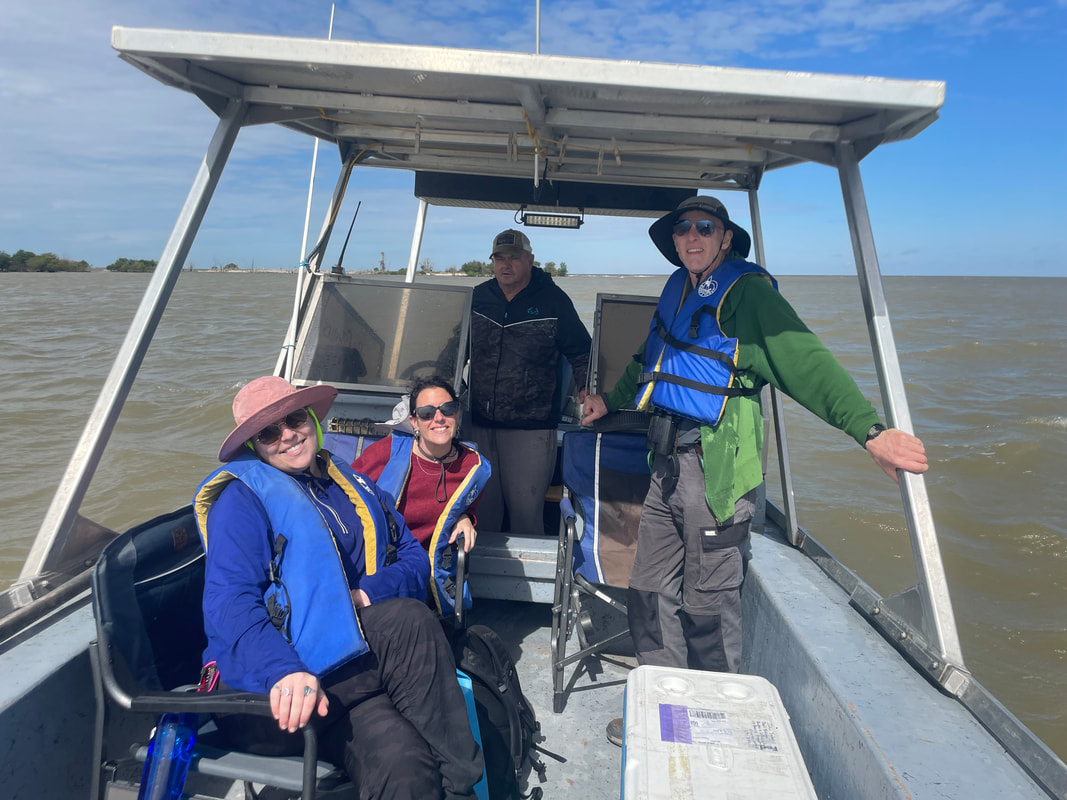 Zoe Kane, me, Brent Smith (our guide) and Christopher Grooms After some meetings with experts in the field, we consider that the best area to work on was the Lake Winnipeg (Manitoba) (we also sampled some ponds in St Martin Lake due to the climatic conditions), where there are several bird colonies that were previously surveyed. After this, taking into account that birds abandon the nests at the beginning of August, we planned the sampling with guides from the area. This field work took place from 29 of August until the 2nd of September. We sampled 8 ponds from 8 islands: Big Egg, Little Tammarak, Black Bear 1 (August 30); Black Bear 2, Black Bear 3 (August 31); Dunsekikan, Kakakokokin, Sugar (September 1st).  Fully equipped! Debido a que mi proyecto trata de estudiar los cambios a largo plazo en poblaciones de aves mediante el uso de la paleolimnología, debíamos escoger un sitio que cumpliera los siguientes requisitos: 1. Que tuviera varias lagunas cercanas unas a otras y que fueran posible ser muestreadas mediante la toma de testigos de sedimento (cores). 2. Que en la mayoría de estas lagunas hubiera colonias de aves acuáticas anidando. 3. Que no hubieran sido previamente estudiadas.  Después de consultar con expertos en aves acuáticas, convenimos que la mejor zona para realizar nuestros muestreos de sedimento sería el Lago Winnipeg (también muestreamos en Lago San Martín debido a las condiciones climáticas que encontramos al llegar), en el que cual hay distintas islas en las que previamente las colonias de aves fueron censadas por ella. Tras esto, teniendo en cuenta que las aves abandonan los nidos a principios de agosto, organizamos el muestreo y la manera de acceder a estas remotas islas. Para ello contactamos con distintos guías de la zona para que nos acercaran a éstas. La salida de campo tuvo lugar desde el día 29 de Agosto hasta el día 2 de Septiembre. En total muestreamos 8 lagunas de 8 islas diferentes: Big Egg, Little Tammarak, Black Bear 1 (30 de Agosto); Black Bear 2, Black Bear 3 (31 de Agosto); Dunsekikan, Kakakokokin, Sugar (1 de Septiembre). 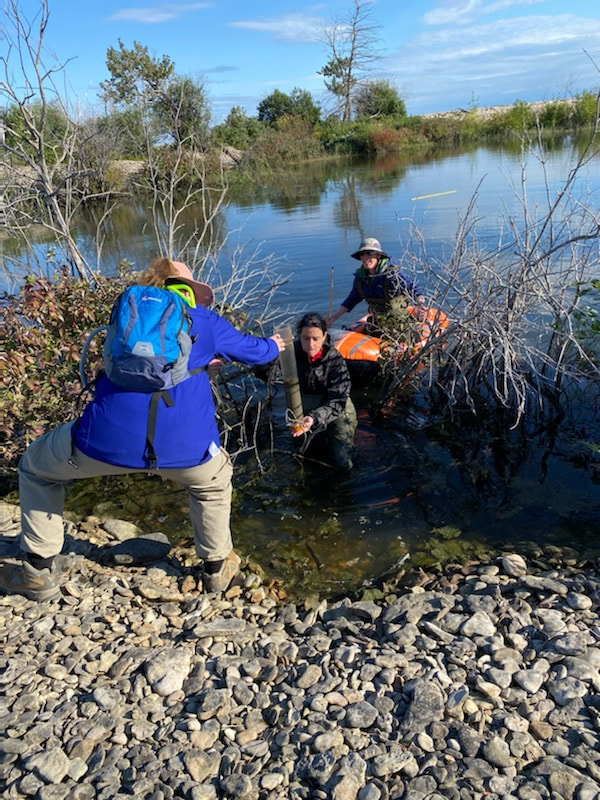 Teamwork!!  Rapid Content Analyzer/Analizador de Chla. With the aim to have more information about the past environmental conditions and nutrients, it is important to measure sedimentary Chla. Therefore, the freeze-dried sediment is sieved (125-µm mesh) and analyzed in glass vials using visible range spectroscopy (VRS) with a Model 6500 series Rapid Content Analyzer (FOSS NIRSystems Inc.). Chlorophyll a concentration was inferred from spectral data using a linear equation obtained from the area under the peak between 650 and 700 nm. More details about this methodology can be found in Michelutti et al. (2010) and Michelutti and Smol (2016). 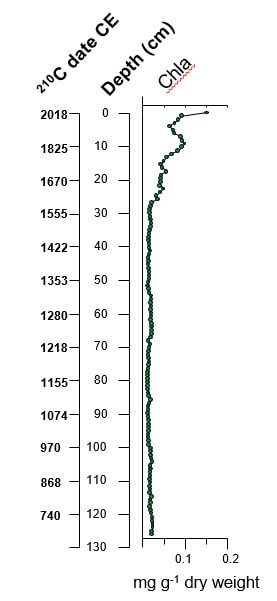 Con el objetivo de obtener una mayor información acerca de los nutrientes presentes en condiciones pasadas, es importante medir la Chla sedimentaria. Para esto, sedimento previamente secado es tamizado (125 µm) y analizado usado el rango de espectroscopía visibles con un Rapid Content Analyzer Modelo 6500 (FOSS NIRSystems Inc.). La concentración de Chla es inferida desde los datos espectrales usando una ecuación linear a su vez obtenida del área bajo el pico entre 650 y 700 nm. Más detalles sobre la metodología pueden consultarse en Michelutti et al. (2010) and Michelutti and Smol (2016).   Phytolith Phytolith Diatoms will provide information about past environmental conditions such as pH or nutrients. Generally, with the aim to select the better dilution, we want to have between 2 and 5 diatom valves per field of view. It is important to cover 1/3-1/2 of the coverslip since the density of the diatoms will be different and the distribution of them could be non-random. Unless we have only one dominant taxa (>95%), we will count approximately 400 valves. The first step will be to take pictures of the most abundant taxa, we will measure them too for making easier their identification. After that, by using some guides such as Krammer and Lange-Bertalot (1986–1991) we will identify the taxa to species if possible. Some other siliceous indicators (cysts, protozoan plates, phytoliths) may be also useful for studying the past environmental conditions. La identificación de las diatomeas nos dará mucha información acerca de condiciones ambientales pasadas como pH o la concentración de nutrientes. Generalmente, para determinar cuál es la mejor dilución para usar, tendremos en cuenta el tener de 2 a 5 valvas de diatomeas por campo de visión. Es importante cubrir 1/3 a ½ del cubreobjetos ya que la densidad de las diatomeas varía y es posible que su distribución no sea del todo aleatoria. A no ser que nuestra muestra sea poco diversa y predomine sólo un taxón con una abundancia >95%, contaremos aproximadamente 400 valvas. El primer paso será tomar fotos de los taxones más abundantes de la muestra, tomaremos medidas de éstos también para facilitar su identificación. Después de esto, utilizando distintas guías de identificación como las de Krammer and Lange-Bertalot (1986–1991) identificaremos los taxones hasta el nivel más bajo posible. Otros indicadores silíceos (quistes, placas de protozoos, fitolitos) pueden ser también útiles a la hora de determinar las condiciones ambientales pasadas. 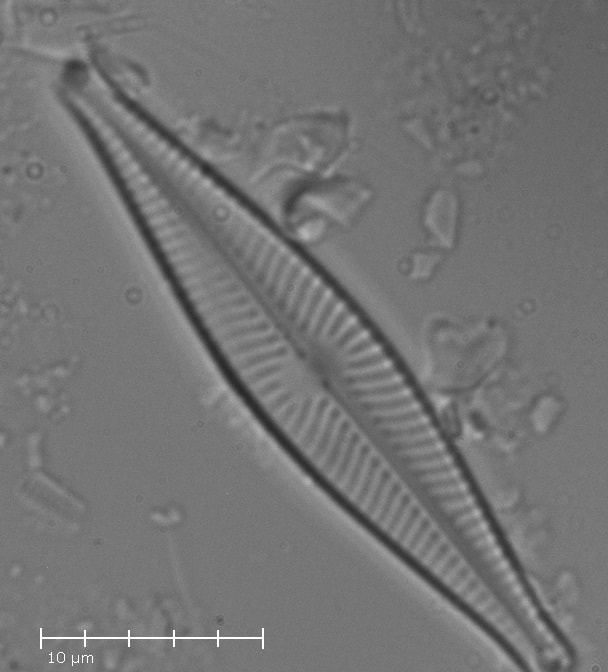 Once our slurries reach neutral pH, aliquots of these slurries will be pipetted onto coverslips. Usually, unless you are sure about the abundance of diatoms that your samples have, 4 concentrations will be used (A, B, C, D) to make our counting factible. It is better to have one of our samples too concentrated, than to have all four samples too sparse. The slurry will be very well mixed before taking a subsample with the pipette by keeping it in constant motion with the pipette. Dilution A will be the slurry without adding any additional water, the rest of dilutions will make by removing 1/2 of the slurry contents one pipette-full at a time and filling the tube's contents with deionized water to about 3/4 full. The coverslips will be dried with a slide warmer. Once we have the coverslip dried, we will place a small drop of NAPHRAX centrally onto a slide, we will pick the cover slip with tweezers and will heat the cover slip by using a hotplate, and we will place the cover slip (side down) onto the NAPHRAX. We will give a gentle tap with the tip of the glass rod to help spread the NAPHRAX. Finally, we will heat the slide on the hotplate until it starts to bubble being careful about not burning the resin. Una vez que el sobrenadante está a pH 7, pipeteamos alícuotas de éstos en cubres. Normalmente, a no ser que estemos seguras acerca de la abundancia de diatomeas en nuestras muestras, usaremos 4 diluciones distintas (A, B, C, D) con el objetivo de hacer factible el conteo, es mejor tener una muestra muy concentrada que cuatro muy diluidas. Mezclaremos muy bien el sobrenadante antes de tomar la submuestra con la pipeta, mezclando continuamente con la pipeta. La dilución A será la submuestra tomada directamente del sobrenadante, el resto de diluciones se harán dejando la mitad del sobrenadante en el tubo y añadiendo agua desionizada hasta llenar el tubo ¾. Los cubres se secarán usando un secador de portaobjetos. Una vez que los cubres están secos, tomaremos con una pipeta un pequeña gota de NAPHRAX y la colocaremos en el cubreobjetos, cogeremos un cubreobjetos con pinzas y lo colocaremos en una placa térmica, tomamos el cubre y lo colocamos boca abajo en el NAPHRAX. Damos unos golpecitos con un palito de vidrio para ayudar a que el NAPHRAX se distribuya mejor. Finalmente, calentamos el portaobjetos en la placa térmica hasta que burbujee teniendo cuidado de no quemar la resina.  Sediment samples in freeze-drier/Muestras de sedimento en el secador (Picture taken by Inmaculada Álvarez-Manzaneda) Once in the lab the first step is to weight the sediment (wet weight), after that we will place the sediment samples in a freezer. The frozen samples will be freeze dried and weighted again (dry weight). This will allow us to know the water content of the samples that will be useful for dating them. Next steps will depend on the indicators that we want to study next. In the case of the diatoms, we will weight approximately 0.1 g of freeze-dried sediment (this will depend on the abundance of diatoms), this sediment will be digested by using a 1:1 molecular weight ratio of concentrated H2SO4 and HNO3 and heated at 80°C for 2 hours. The slurry will be rinsed every 24 hours with deionized water until neutral pH. This is carried out with the aim to eliminate the organic matter from the samples, since diatoms are composed by silica they will not be affected by acids. Una vez en el laboratorio el primer paso será pesar las muestras de sedimento (esto será nuestro peso húmedo), a continuación, colocaremos las muestras en el congelador. Después las muestras congeladas serán secadas y pesadas de nuevo (peso seco). Esto será útil para obtener el porcentaje de humedad de las muestras que necesitaremos para la datación de éstas. Los siguientes pasos dependerán de los indicadores con los que queramos trabajar a continuación. En el caso de que vayamos a estudiar diatomeas, debemos pesar aproximadamente 0.1 gramos de sedimento seco (esto dependerá de la abundancia de diatomeas en la muestra), este sedimento será digerido usando H2SO4 and HNO3 concentrado (1:1 peso molecular) y calentado a 80°C durante 2 horas. El sobrenadante será lavado cada día con agua desionizada hasta alcanzar un pH neutro. Esto se realiza con el fin de eliminar la materia orgánica presente en la muestra y quedarnos sólo con las diatomeas que, al estar compuestas mayoritariamente por sílice, no se verán afectadas por el ácido. 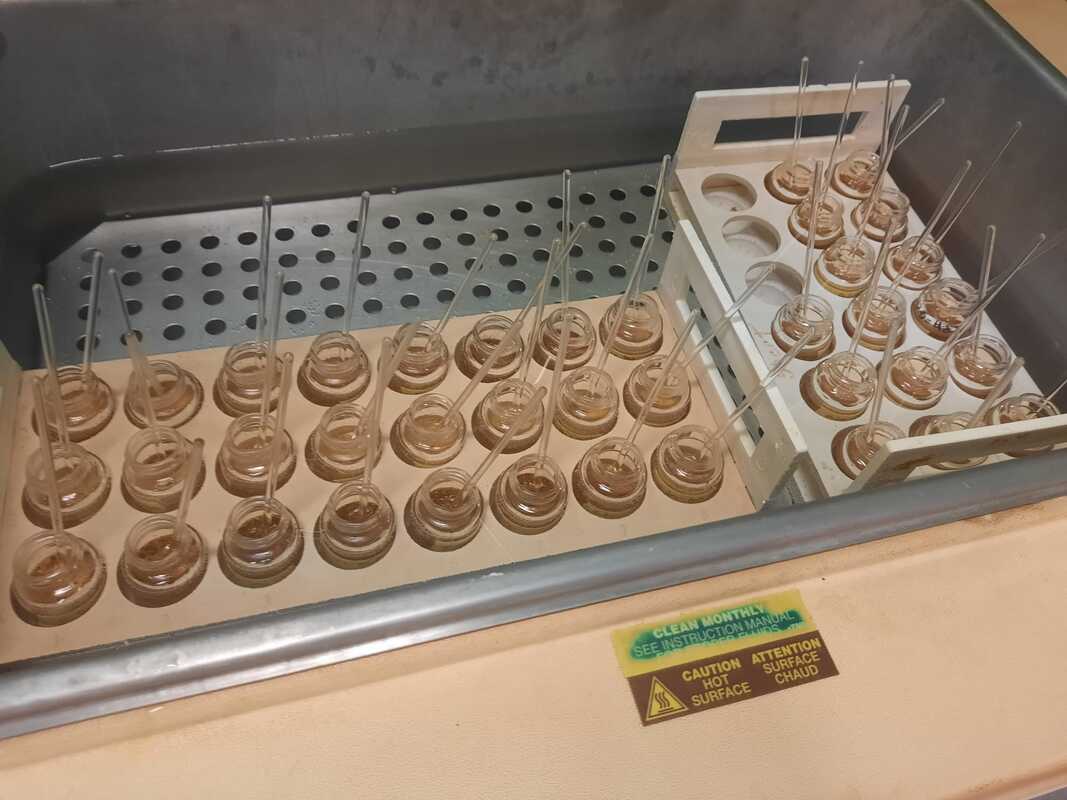 Samples being digested/Muestras en digestión (Picture taken by Inmaculada Álvarez-Manzaneda)  Chris Grooms y yo seccionando un core de sedimento en Matheson Island/Chris Grooms and me extruding a sediment core in Matheson Island (Picture taken by Zoe Kane) Una vez que tenemos el core de sedimento procederemos a seccionarlo. Normalmente nosotros realizamos secciones de 0.5 cm, pero dependerá del período qué queramos estudiar y de la tasa de sedimentación del lago. Tenemos que tener en cuenta que el sedimento de la capa más superficial será el más "nuevo" mientras que conforme vayamos profundizando en éste, el tiempo que tiene ese sedimento irá aumentando.
Realizamos las distintas secciones colocando el sedimento en bolsas herméticas las cuales irán rotuladas con el nombre del lago, fecha e intervalo (por ejemplo 0-0.5 cm) y que serán colocadas en una nevera. ------------------------------------------------------------------------------------------------ After sampling the sediment core we will section it by using a extruder. Normally we use sections every 0.5 cm, but this should depend on the period that we want to study as well as the sedimentation rate of the lake. It is needed to have in mind that the most superficial section in the sediment will be the "youngest" while the deeper intervals will be more and more older. Every section of the sediment will be placed in a zip bag that will be labeled with the name of the lake, date of sampling and interval (e.g. 0-0.5 cm). Bags will be stored in coolers. More info: https://www.queensu.ca/pearl/methods/extruding.php Los sedimentos de los lagos actúan como archivos de eventos pasados, y por lo tanto si estudiamos éstos podremos obtener mucha información acerca de los organismos que vivieron hace siglos en ese ecosistema, las condiciones ambientales que se daban... Así que lo primero que tendremos que hacer será muestrear estos sistemas, dependiendo de la profundidad de éste utilizaremos un método u otro para obtener nuestro testigo (=core) de sedimento. ------------------------- Lake sediments act as archives of past events, so by studying them we could be able to obtain a lot of information about species that lived there centuries ago or which environment conditions occurred at that moment. Therefore, the first step is to sample the sediment from the lake, and depending on the depth of the pond we will use one or other technique to obtain our sediment core. 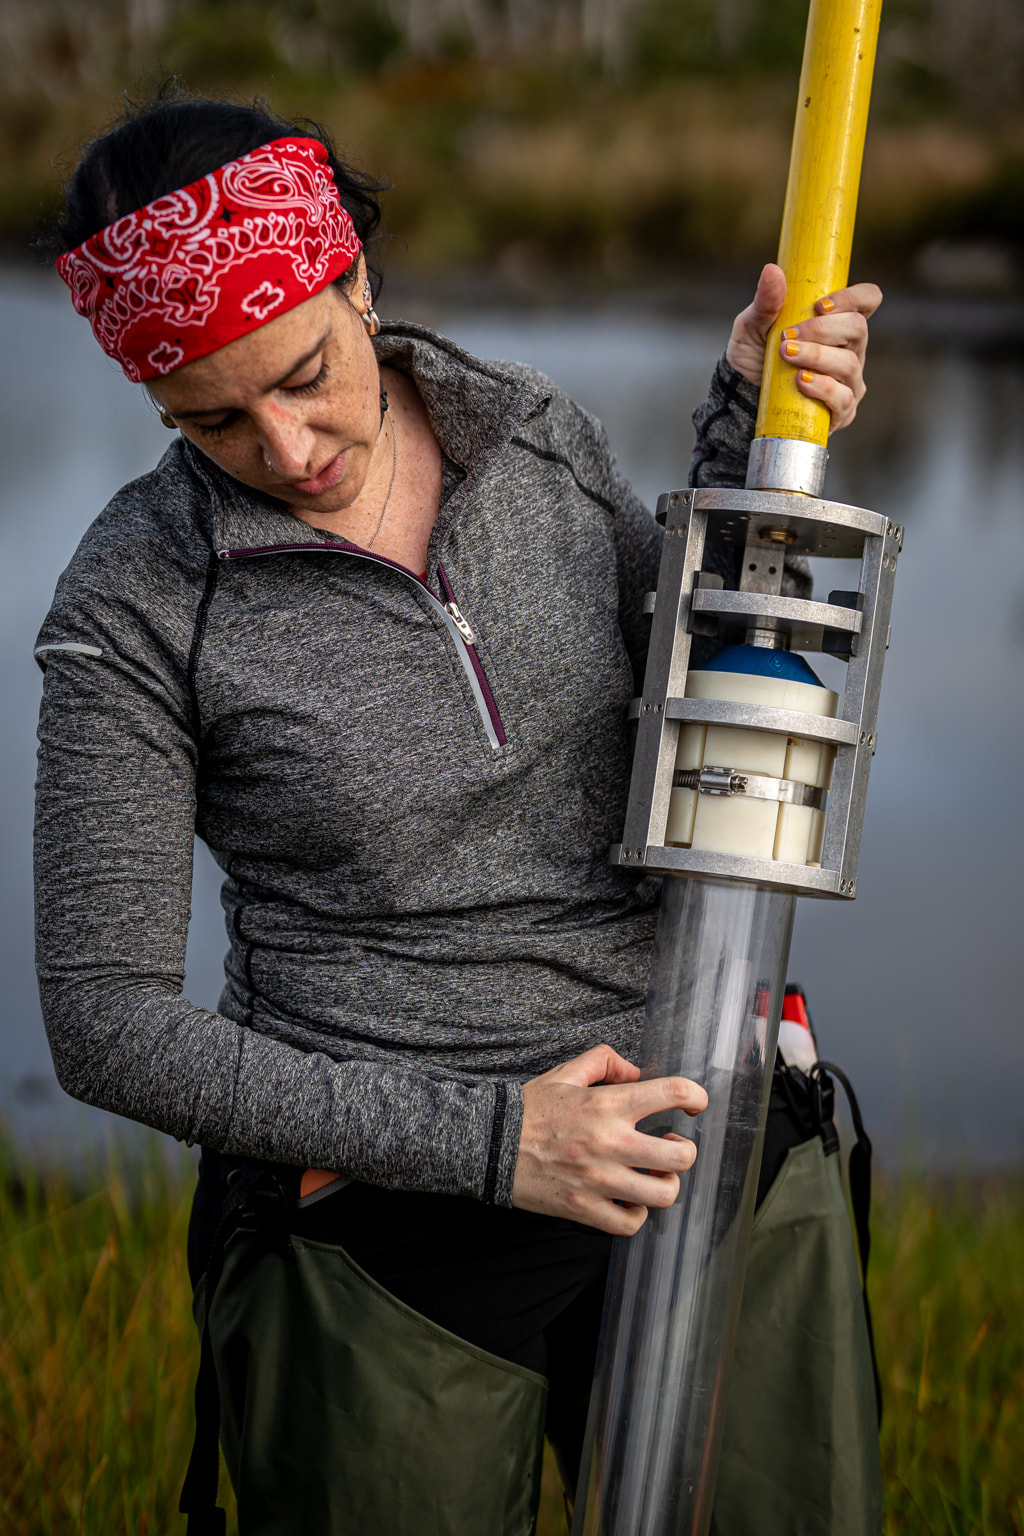 Yo enseñando un core para muestrear en Nueva Escocia/Me showing a core for sampling in Nova Scotia (Picture from SOI foundation). 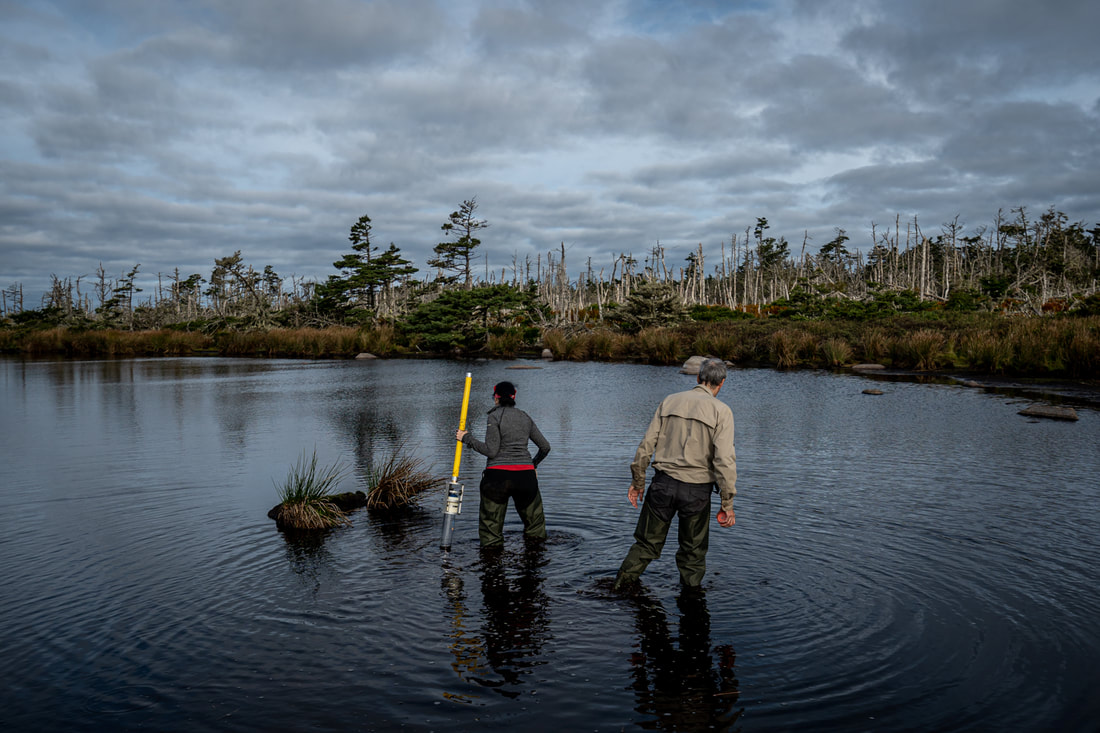 Doug Hynes y yo en un muestreo en Nueva Escocia/Doug Hynes and me during a sampling in Nova Scotia (Picture from SOI foundation). 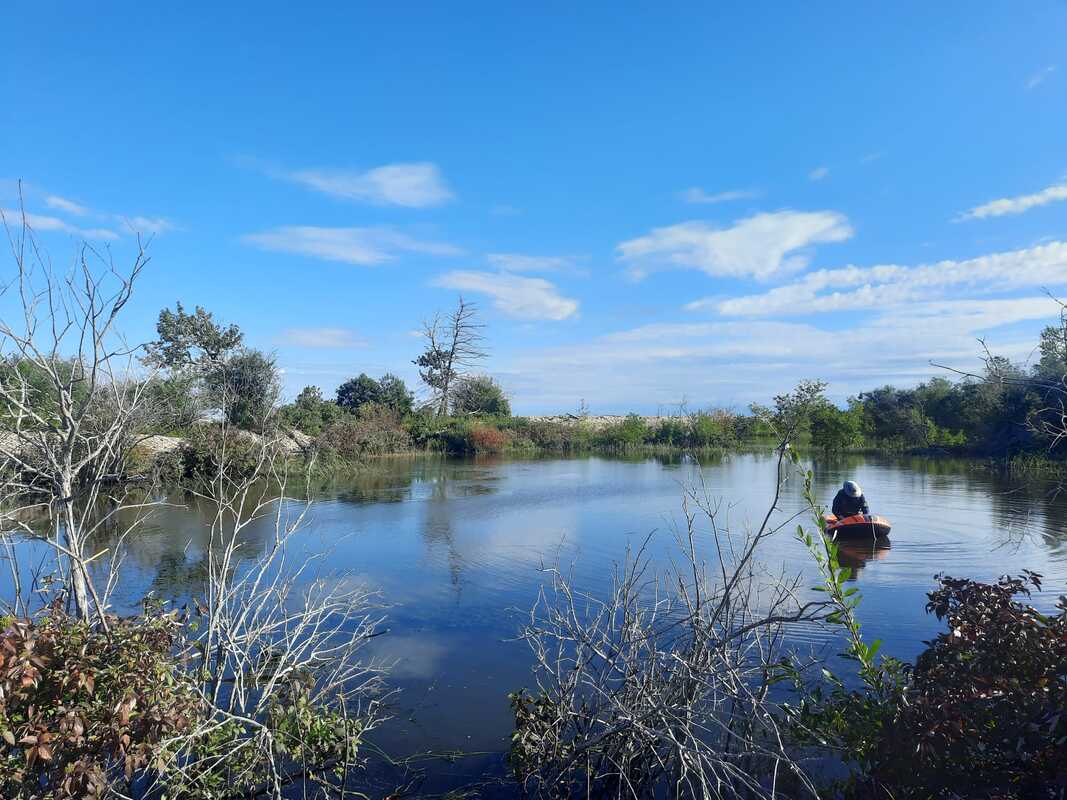 PAST es un proyecto financiado por la Comisión Europea, dentro de las acciones Marie Skłodowska-Curie, gracias a la cual estoy desarrollando mi investigación postdoctoral. Este proyecto trata de estudiar los cambios pasados que han sufrido poblaciones de aves debido a sequías y otros estresores climáticos usando técnicas paleolimnológicas. Nuestro principal objetivo es estudiar las consecuencias que han tenido, tienen y tendrán estos eventos sobre las poblaciones de aves según los registros paleolimnológicos.
----------------------- PAST is a project funded by the European Commision within their Marie Skłodowska-Curie Actions, thanks to this fellowship I am developing my postdoctoral research. The main objective of this project is to study how past droughts and other climate extremes have affected long-term dynamics of bird populations using paleolimnological approaches. Within our broader goal of studying the consequences that droughts and other extreme climate events had, have and will have on bird populations according to paleolimnological records, |
AuthorWrite something about yourself. No need to be fancy, just an overview. Archives
October 2022
Categories |
 RSS Feed
